

Autism in Numbers and Stories
Project Team: Kimberley Isett, Nassim Jafarinaimi, Loren Crawford, Binjie Sun, Brighton Vino Jegarajan
My Role: Website and Data Visualization Design and Development
Tools: User Research, Illustrator, Photoshop, HTML, CSS, D3.js
Worked with researchers from both Public Policy and Digital Media departments to create evidence-based visual arguments for early intervention in Autism Spectrum Disorder in Georgia. The story and data that we researched, collected and visualized is served as a method to convince Georgia legislators to better support Autistic Children and family.
Background
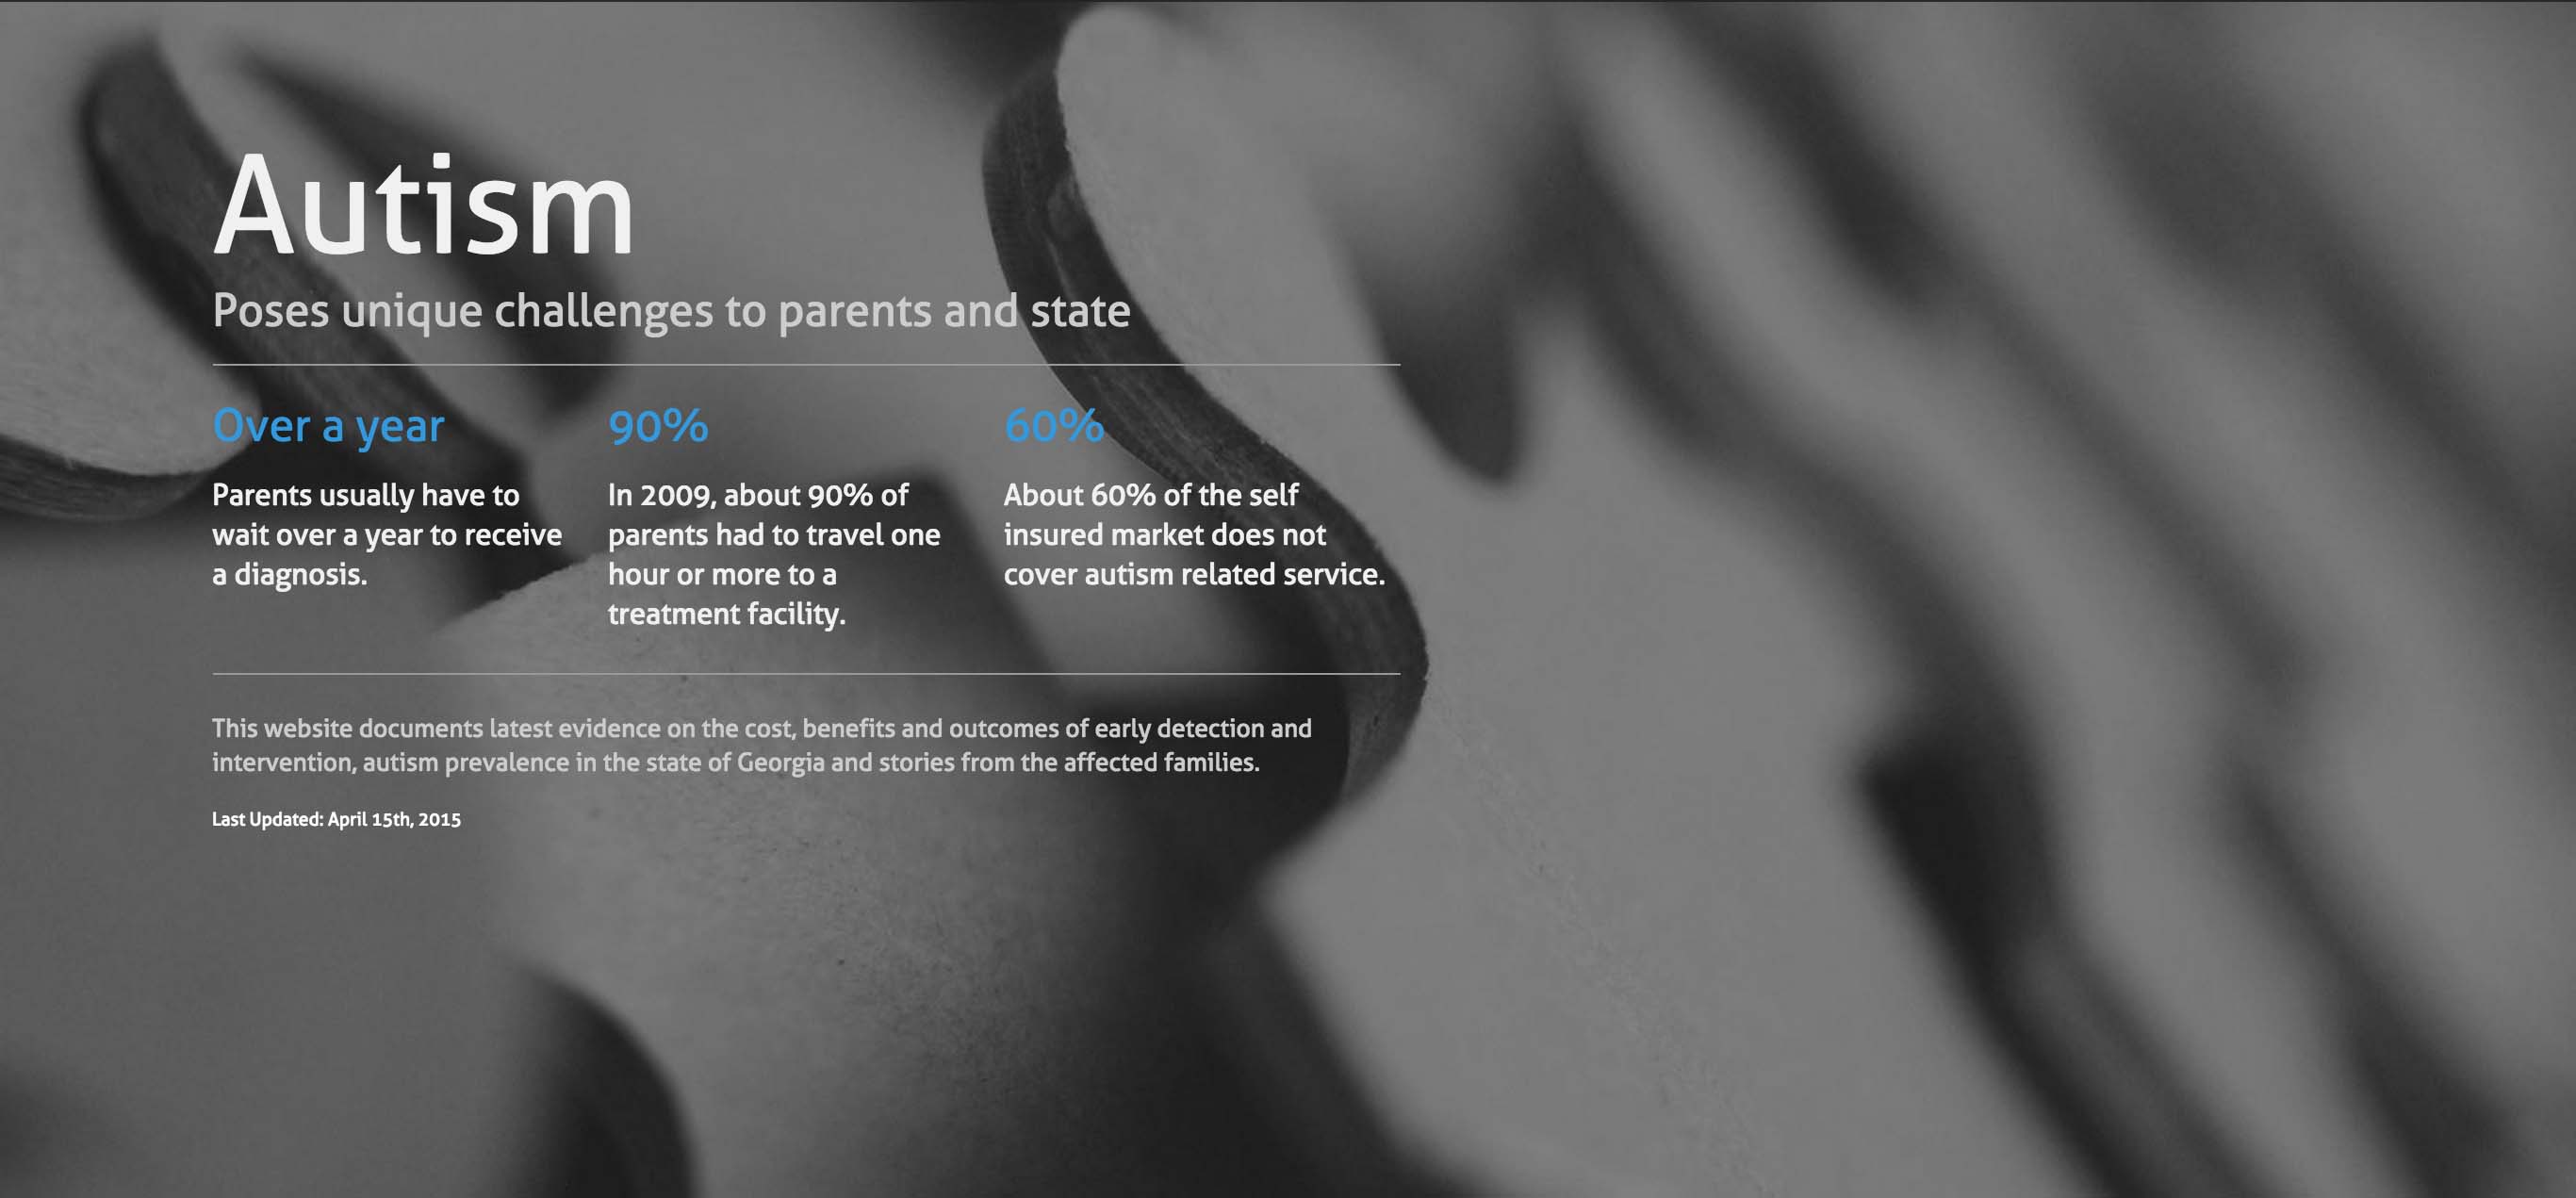
Autism poses unique challenges to parents and state.
- Parents usually have to wait over a year to receive a diagnosis.
- In 2009, about 90% of parents had to travel one hour or more to a treatment facility.
- About 60% of the self insured market does not cover autism related service.
The goal with this website is to documents latest evidence on the cost, benefits and outcomes of early detection and intervention, autism prevalence in the state of Georgia and stories from the affected families. Eventually, they will services as both qualitative and quantitative evidences to convince Georgia legislators to better support Autistic Children and family.
Approach
The approach we take is two-fold. One part of it is to tell a compelling story. To do that, the team has conducted activities such as focus group, persona development, user interviews and literature review. Another part of it is data. Researcher from our team has conducted a large amount of literature reviews to come up with evidence-based arguments that related to our goal. With both, we have a strong combination of stories and data to show the impact of early intervention in autism.
Design Strategy
Our design strategy relates to our needs and solves the problem.
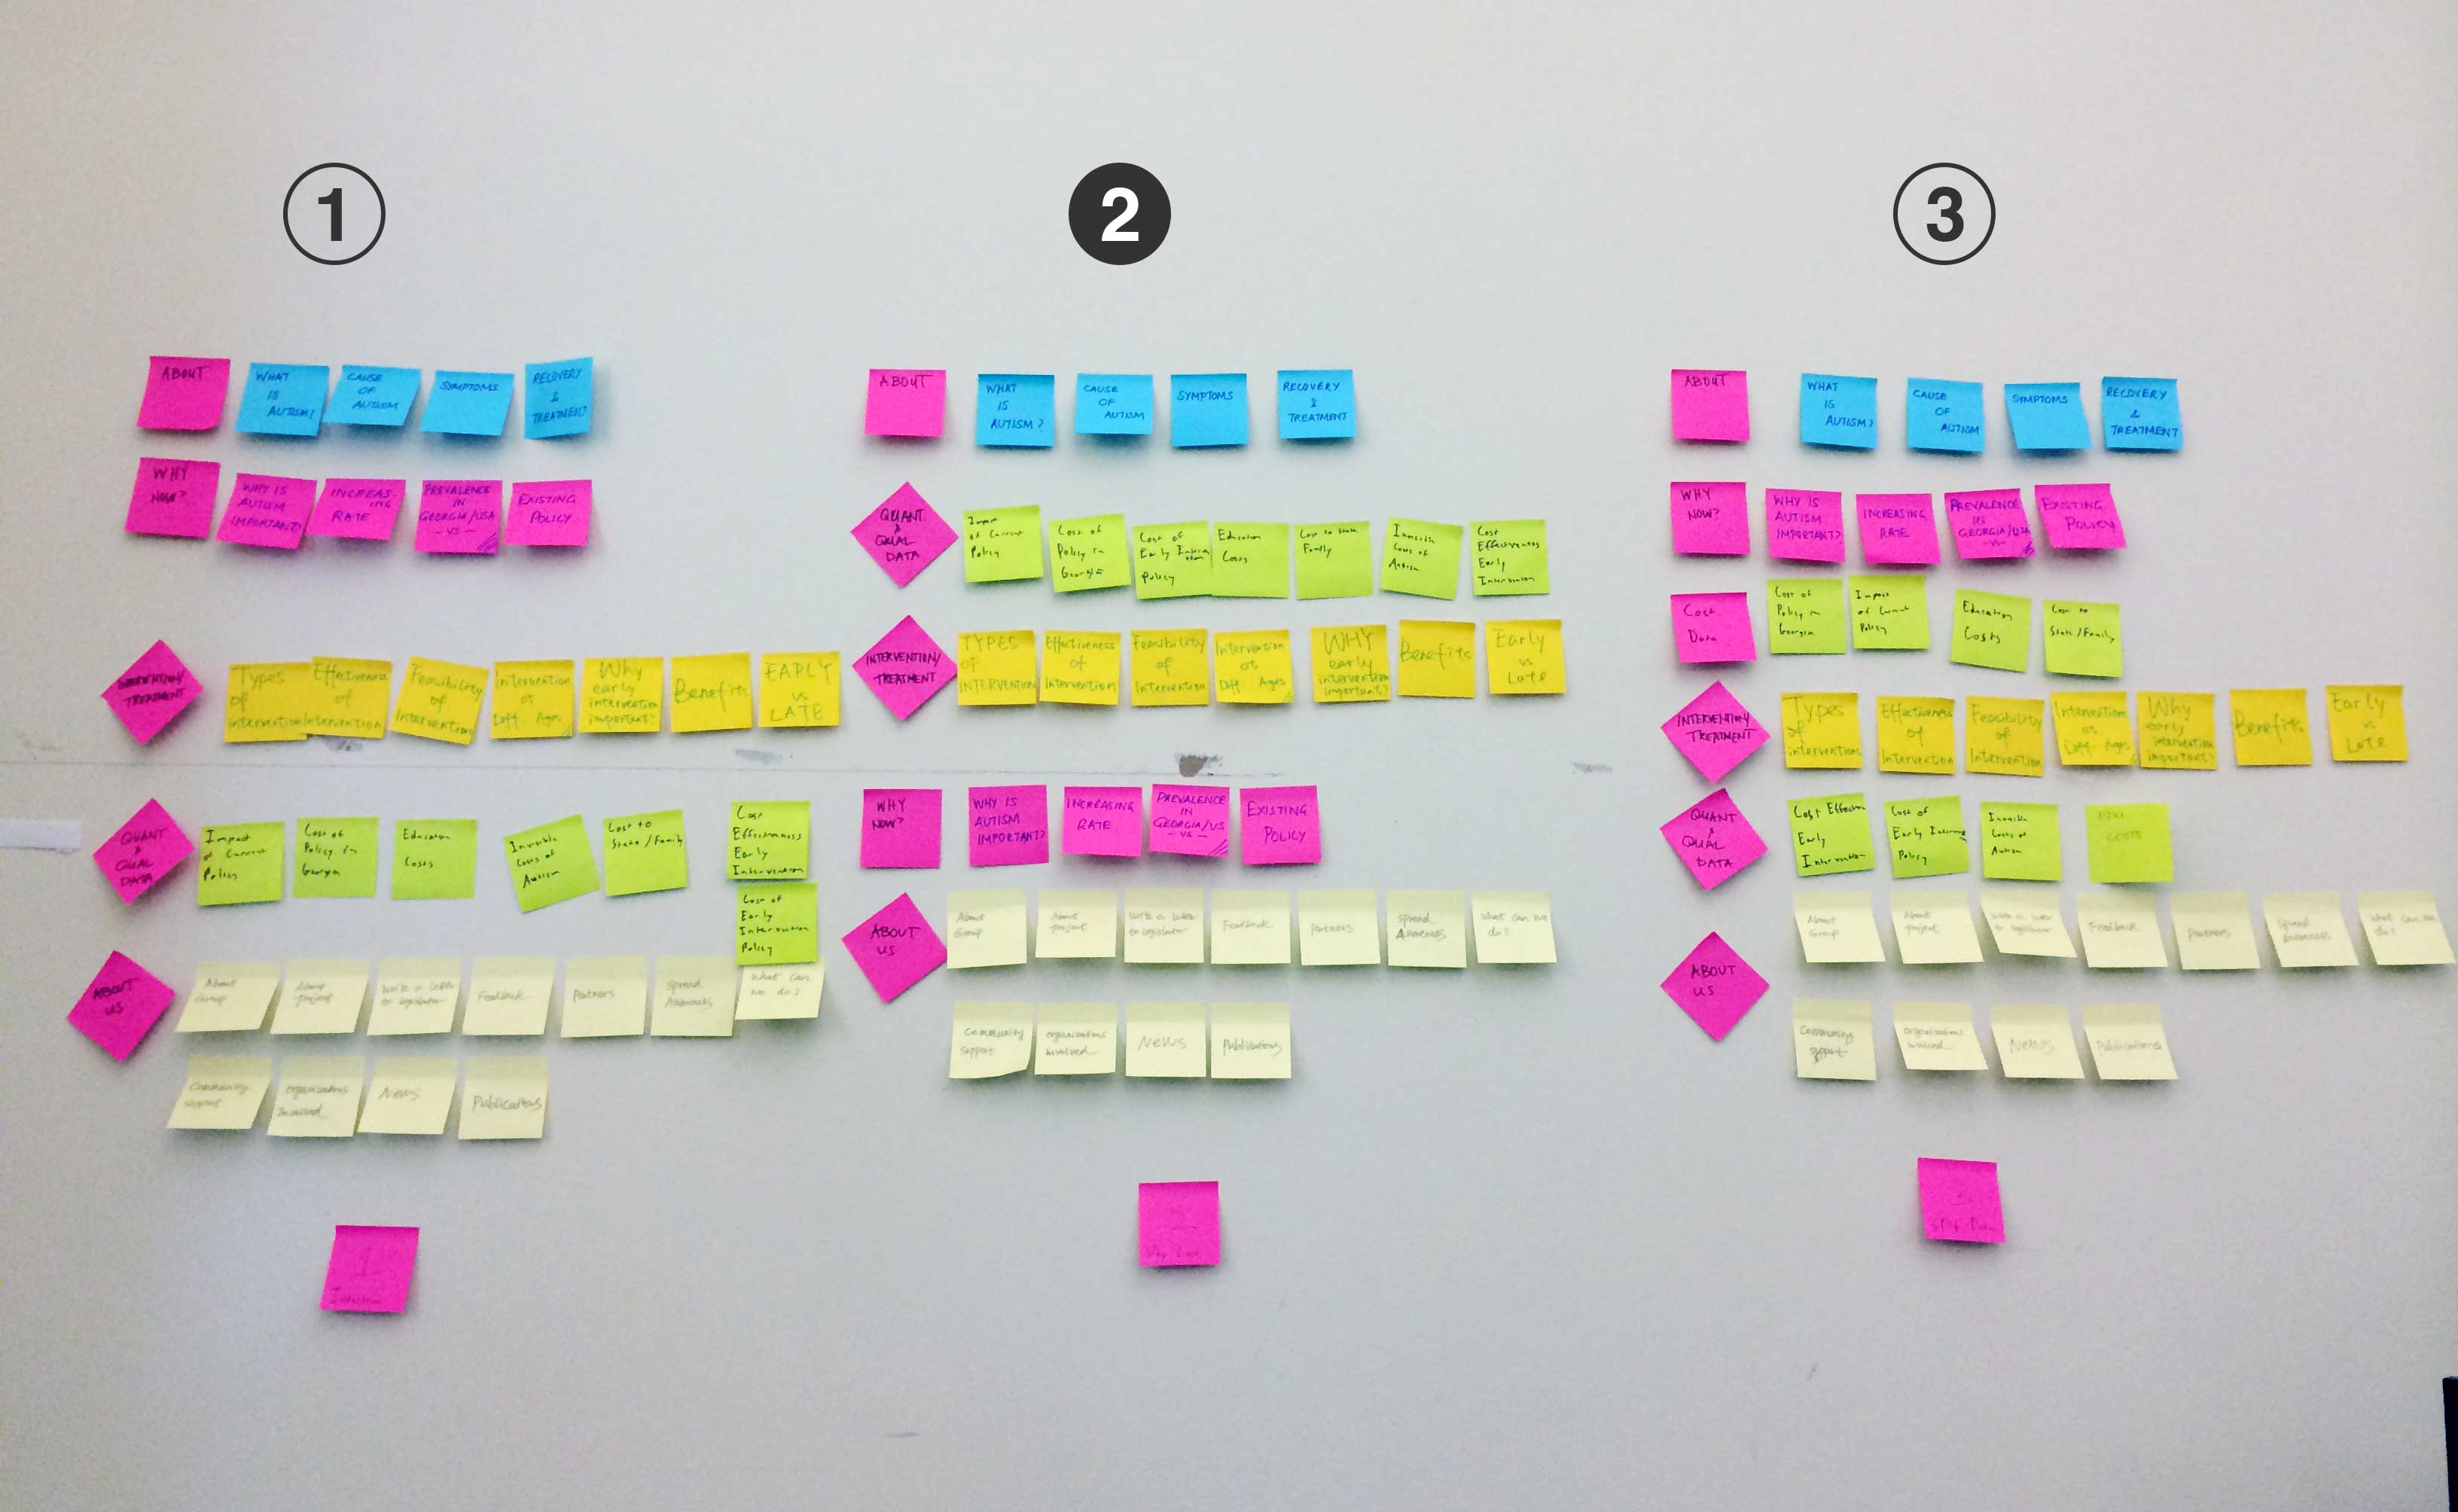
- We started with brianstorming the requirments for the website, with specific methods like card sorting.
- Once we had solid requirments, the design team started to work on some early information architecture and rough concept. In the meantime, researcher is conducting literature review and collecting data.
- Then we talked to autistic families and communities about their experience to understand their needs.
- After we have developed a good sense of the project, we started to engage with our stakeholders.
- Then we carried out the iterative research and design process. Collect data -> Analyze data -> Create visualizations -> Write up stories -> Get feedback -> Test -> Combine them into a website -> Repeat
- We synced with stakeholders along the way multiple times and constantly engaged with autistic families and communities.
- Note: it is more than just a linear process, we have to constantly adapt to new requirements along the way.
Initial Information Architecture
The initial information architecture of the website is an attempt to figure out the main structure of the website includig intro, autism situation and actions. Then further break down autism situations and actions into smaller sections, with the aim to touch on the important aspects realted to autism to meet our defined requirements in a logical and compelling way.
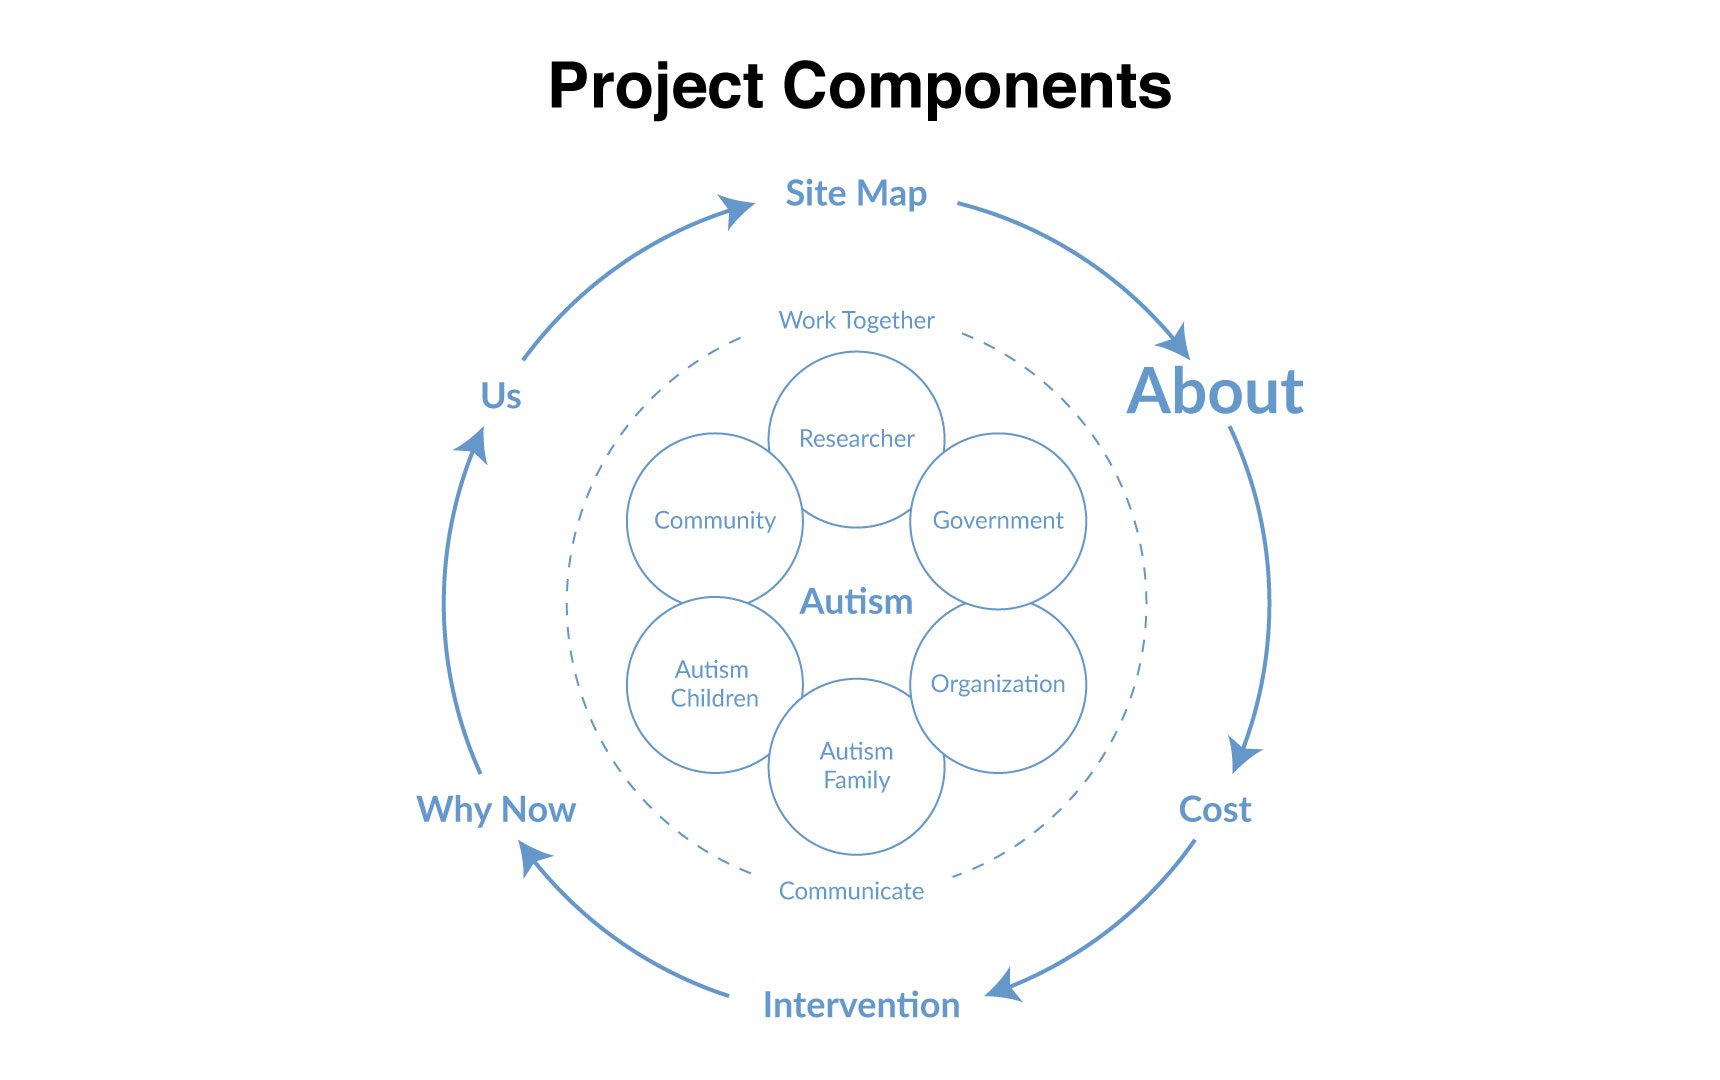
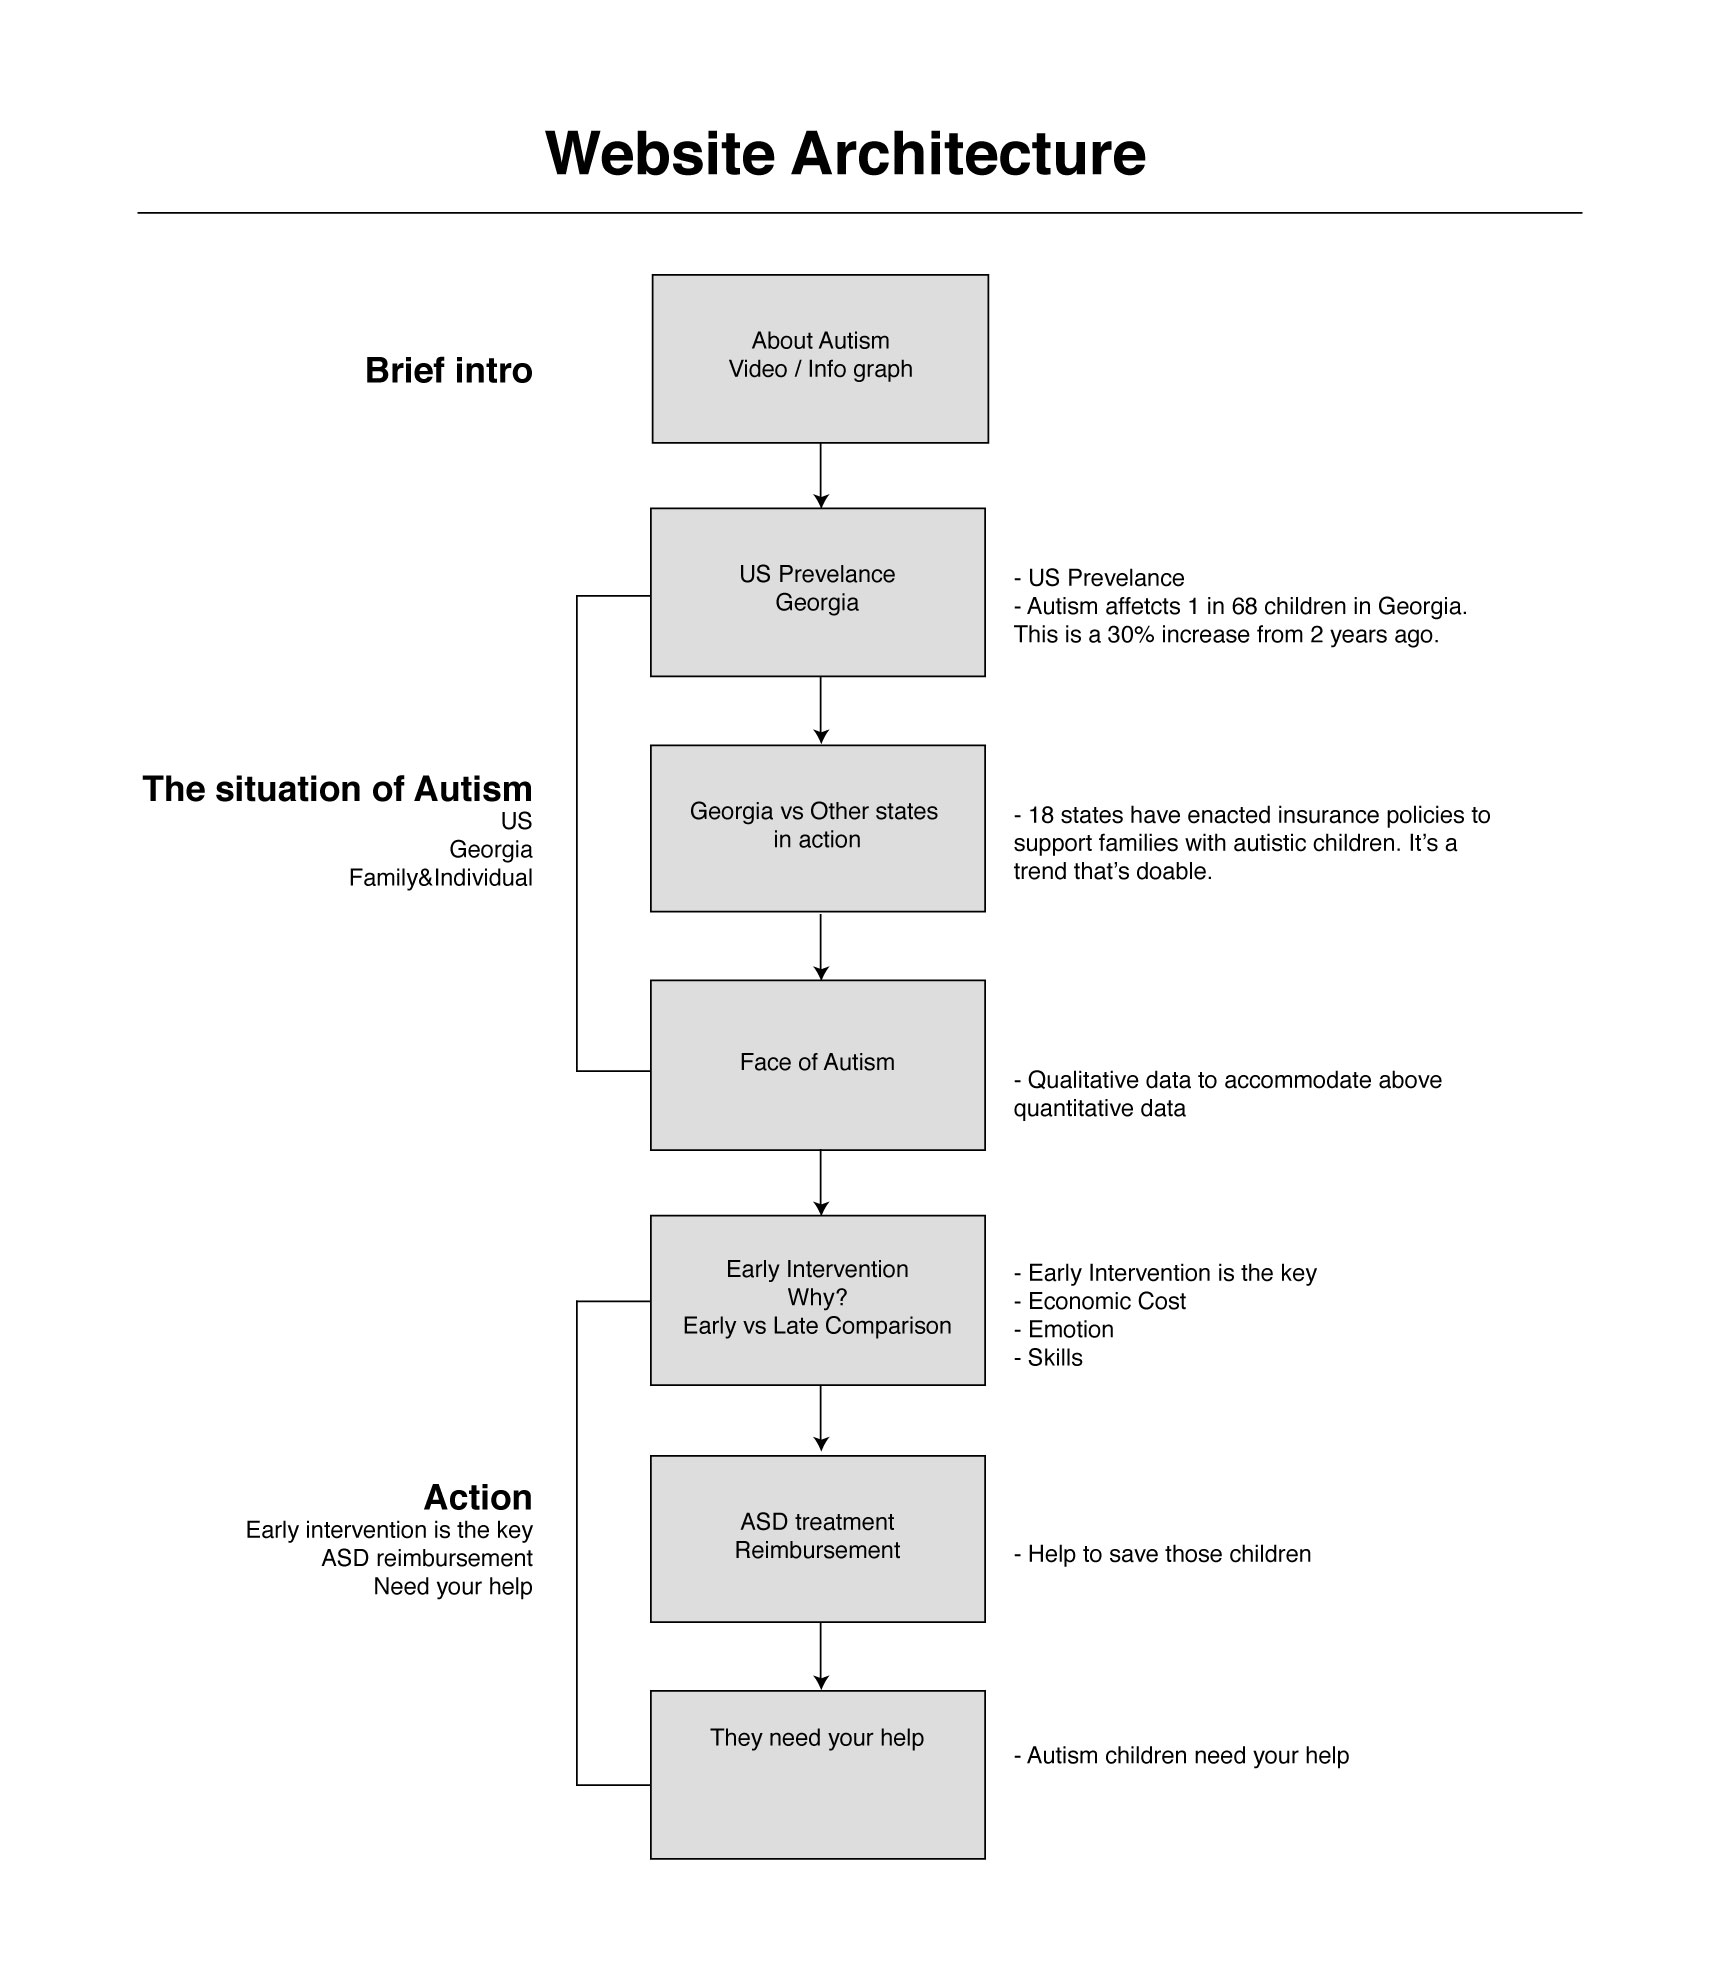
Site Map and Detailed Information Architecture
Site map is created to understand the flow and hierarchy of our website better. As you can see, the core of the chart is autism and surrounding researchers, organization and communities, all those people work togethe can create the foundation of our project. With that, we can build the website on top of it with a simple but meaningful flow.
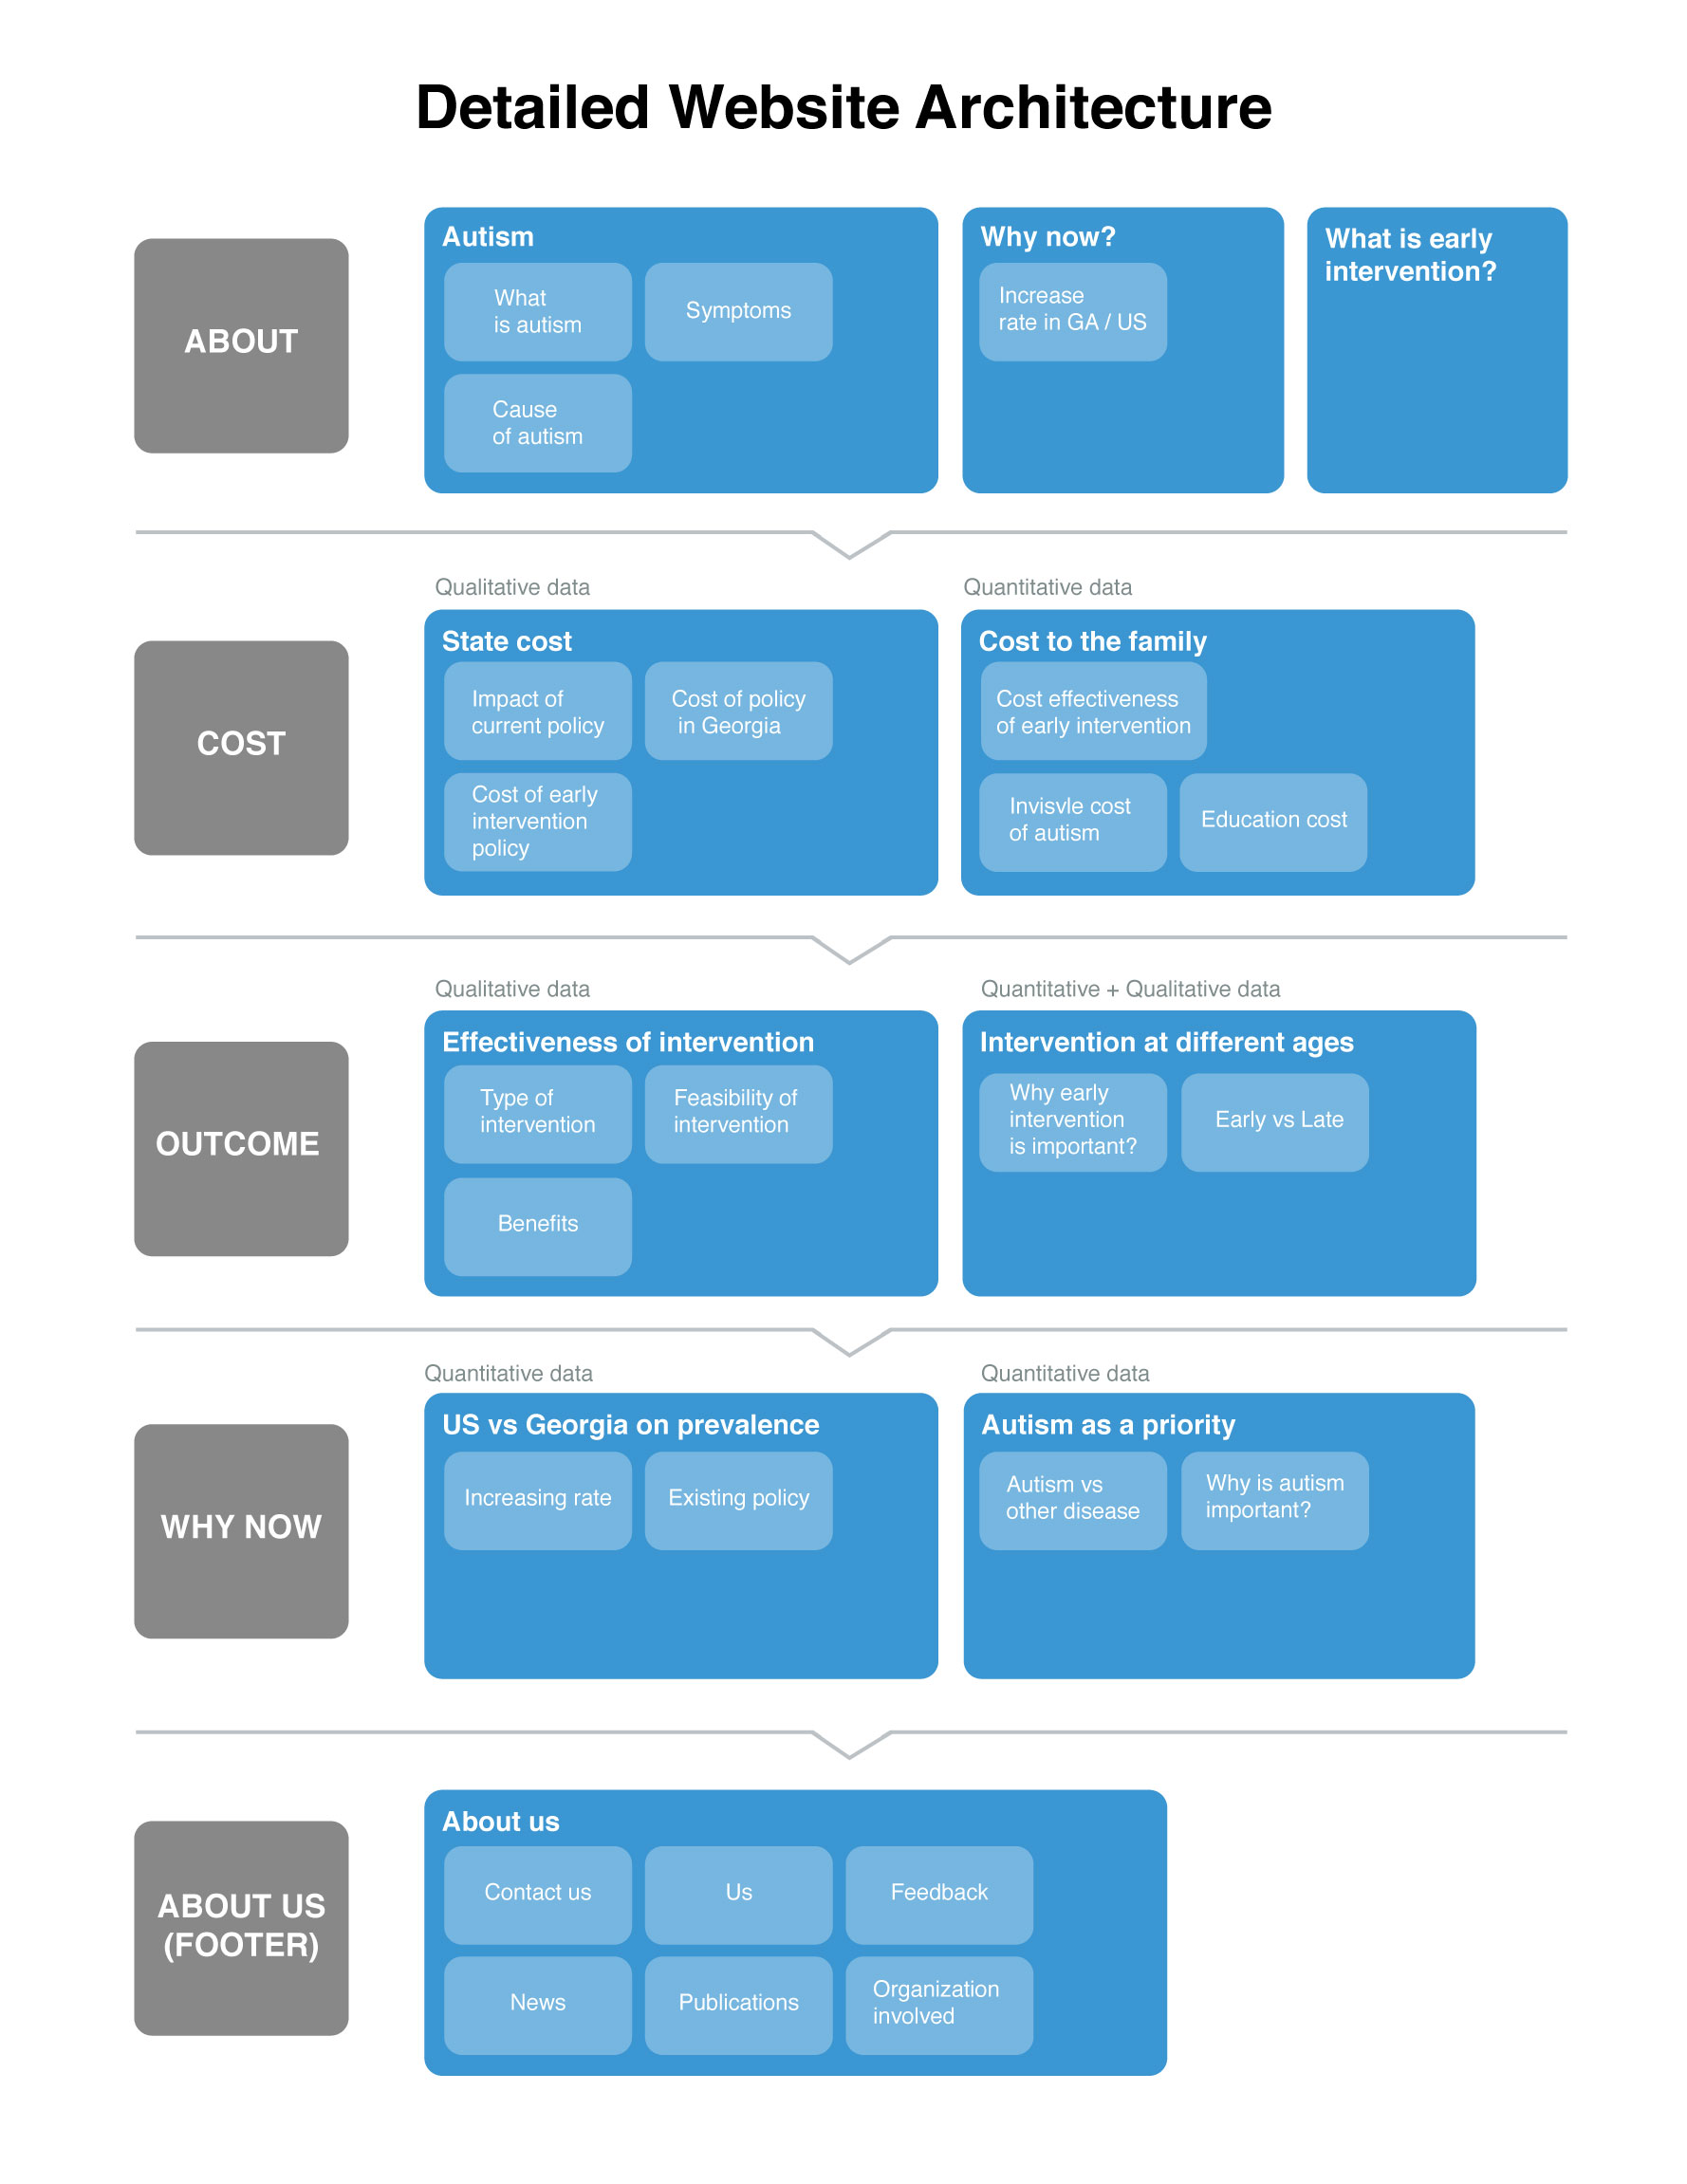
Detailed information architecture is built based on the previous version. It's diving into more details of the website besides the early high-level logical view. As seen from the chart, now the entire flow is simplified into just 5 sections with the core components being autism realted cost, outcome and prevalence. Within each of those core sections, they include further details of the composition.
Note: Data in the chart above is dummy data for design concept purpose only. The actual implementation is similar.
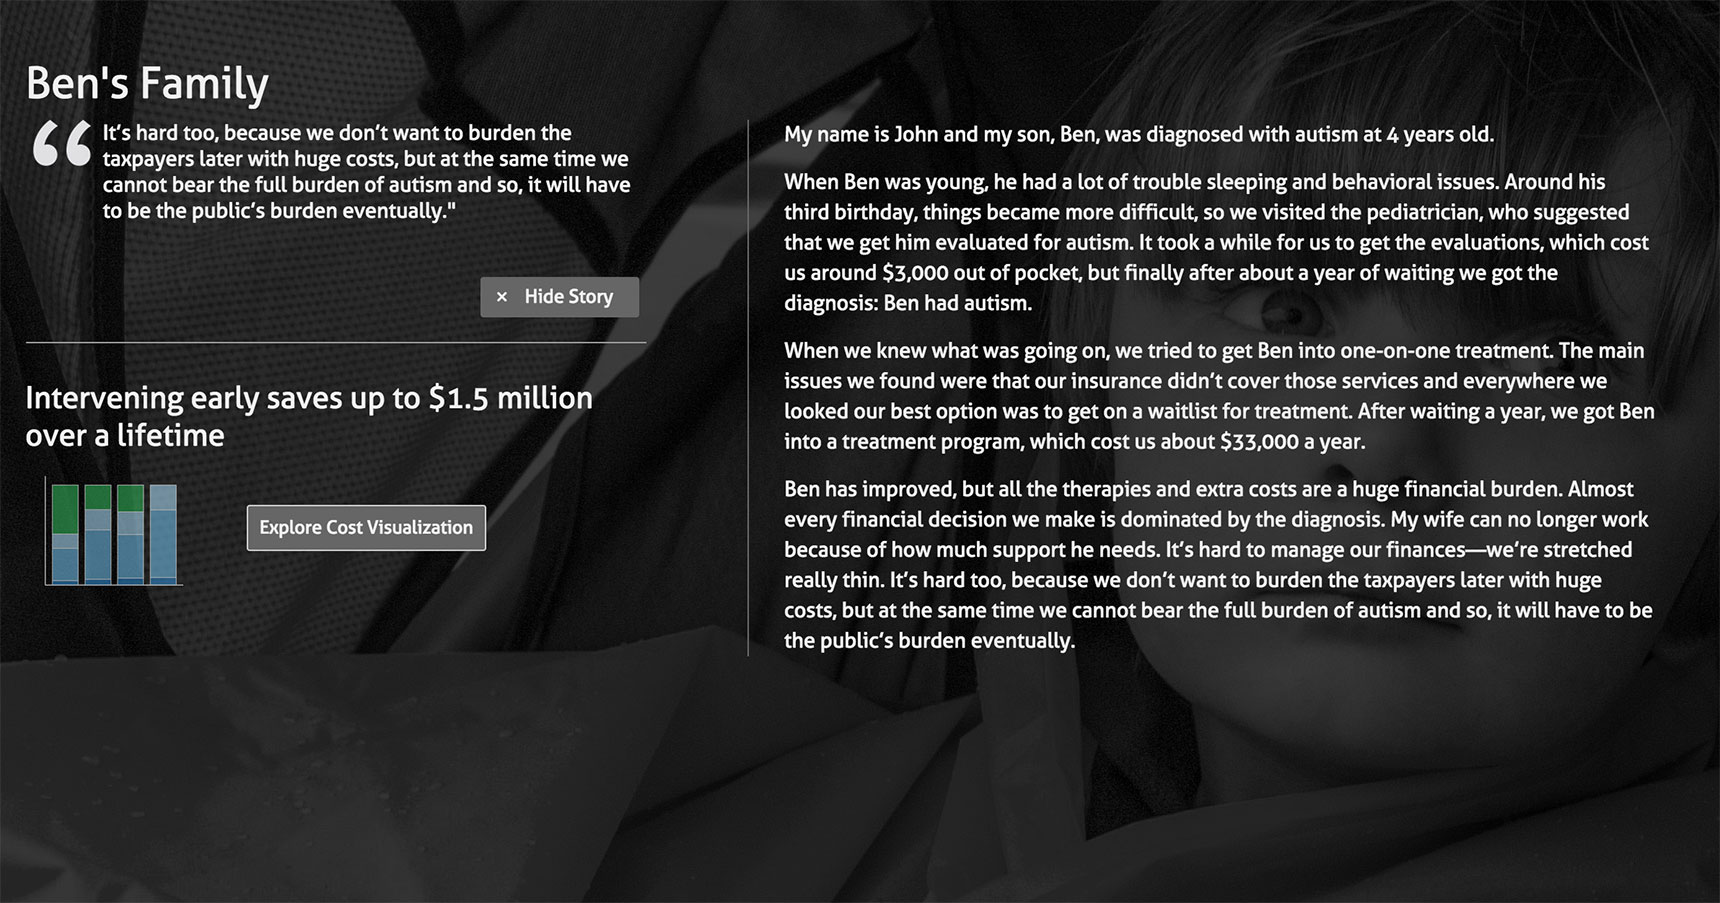
Autism Cost - Interverning early saves up to $1.5 million over a lifetime
Autism Spectrum Disorder (ASD) is an expensive condition. A person with ASD incurs more costs over the lifetime than a person without a development disability. The literature shows intervening early can reduce lifetime cost.
Note: Data in the chart above is dummy data for design concept purpose only. The actual implementation is similar.
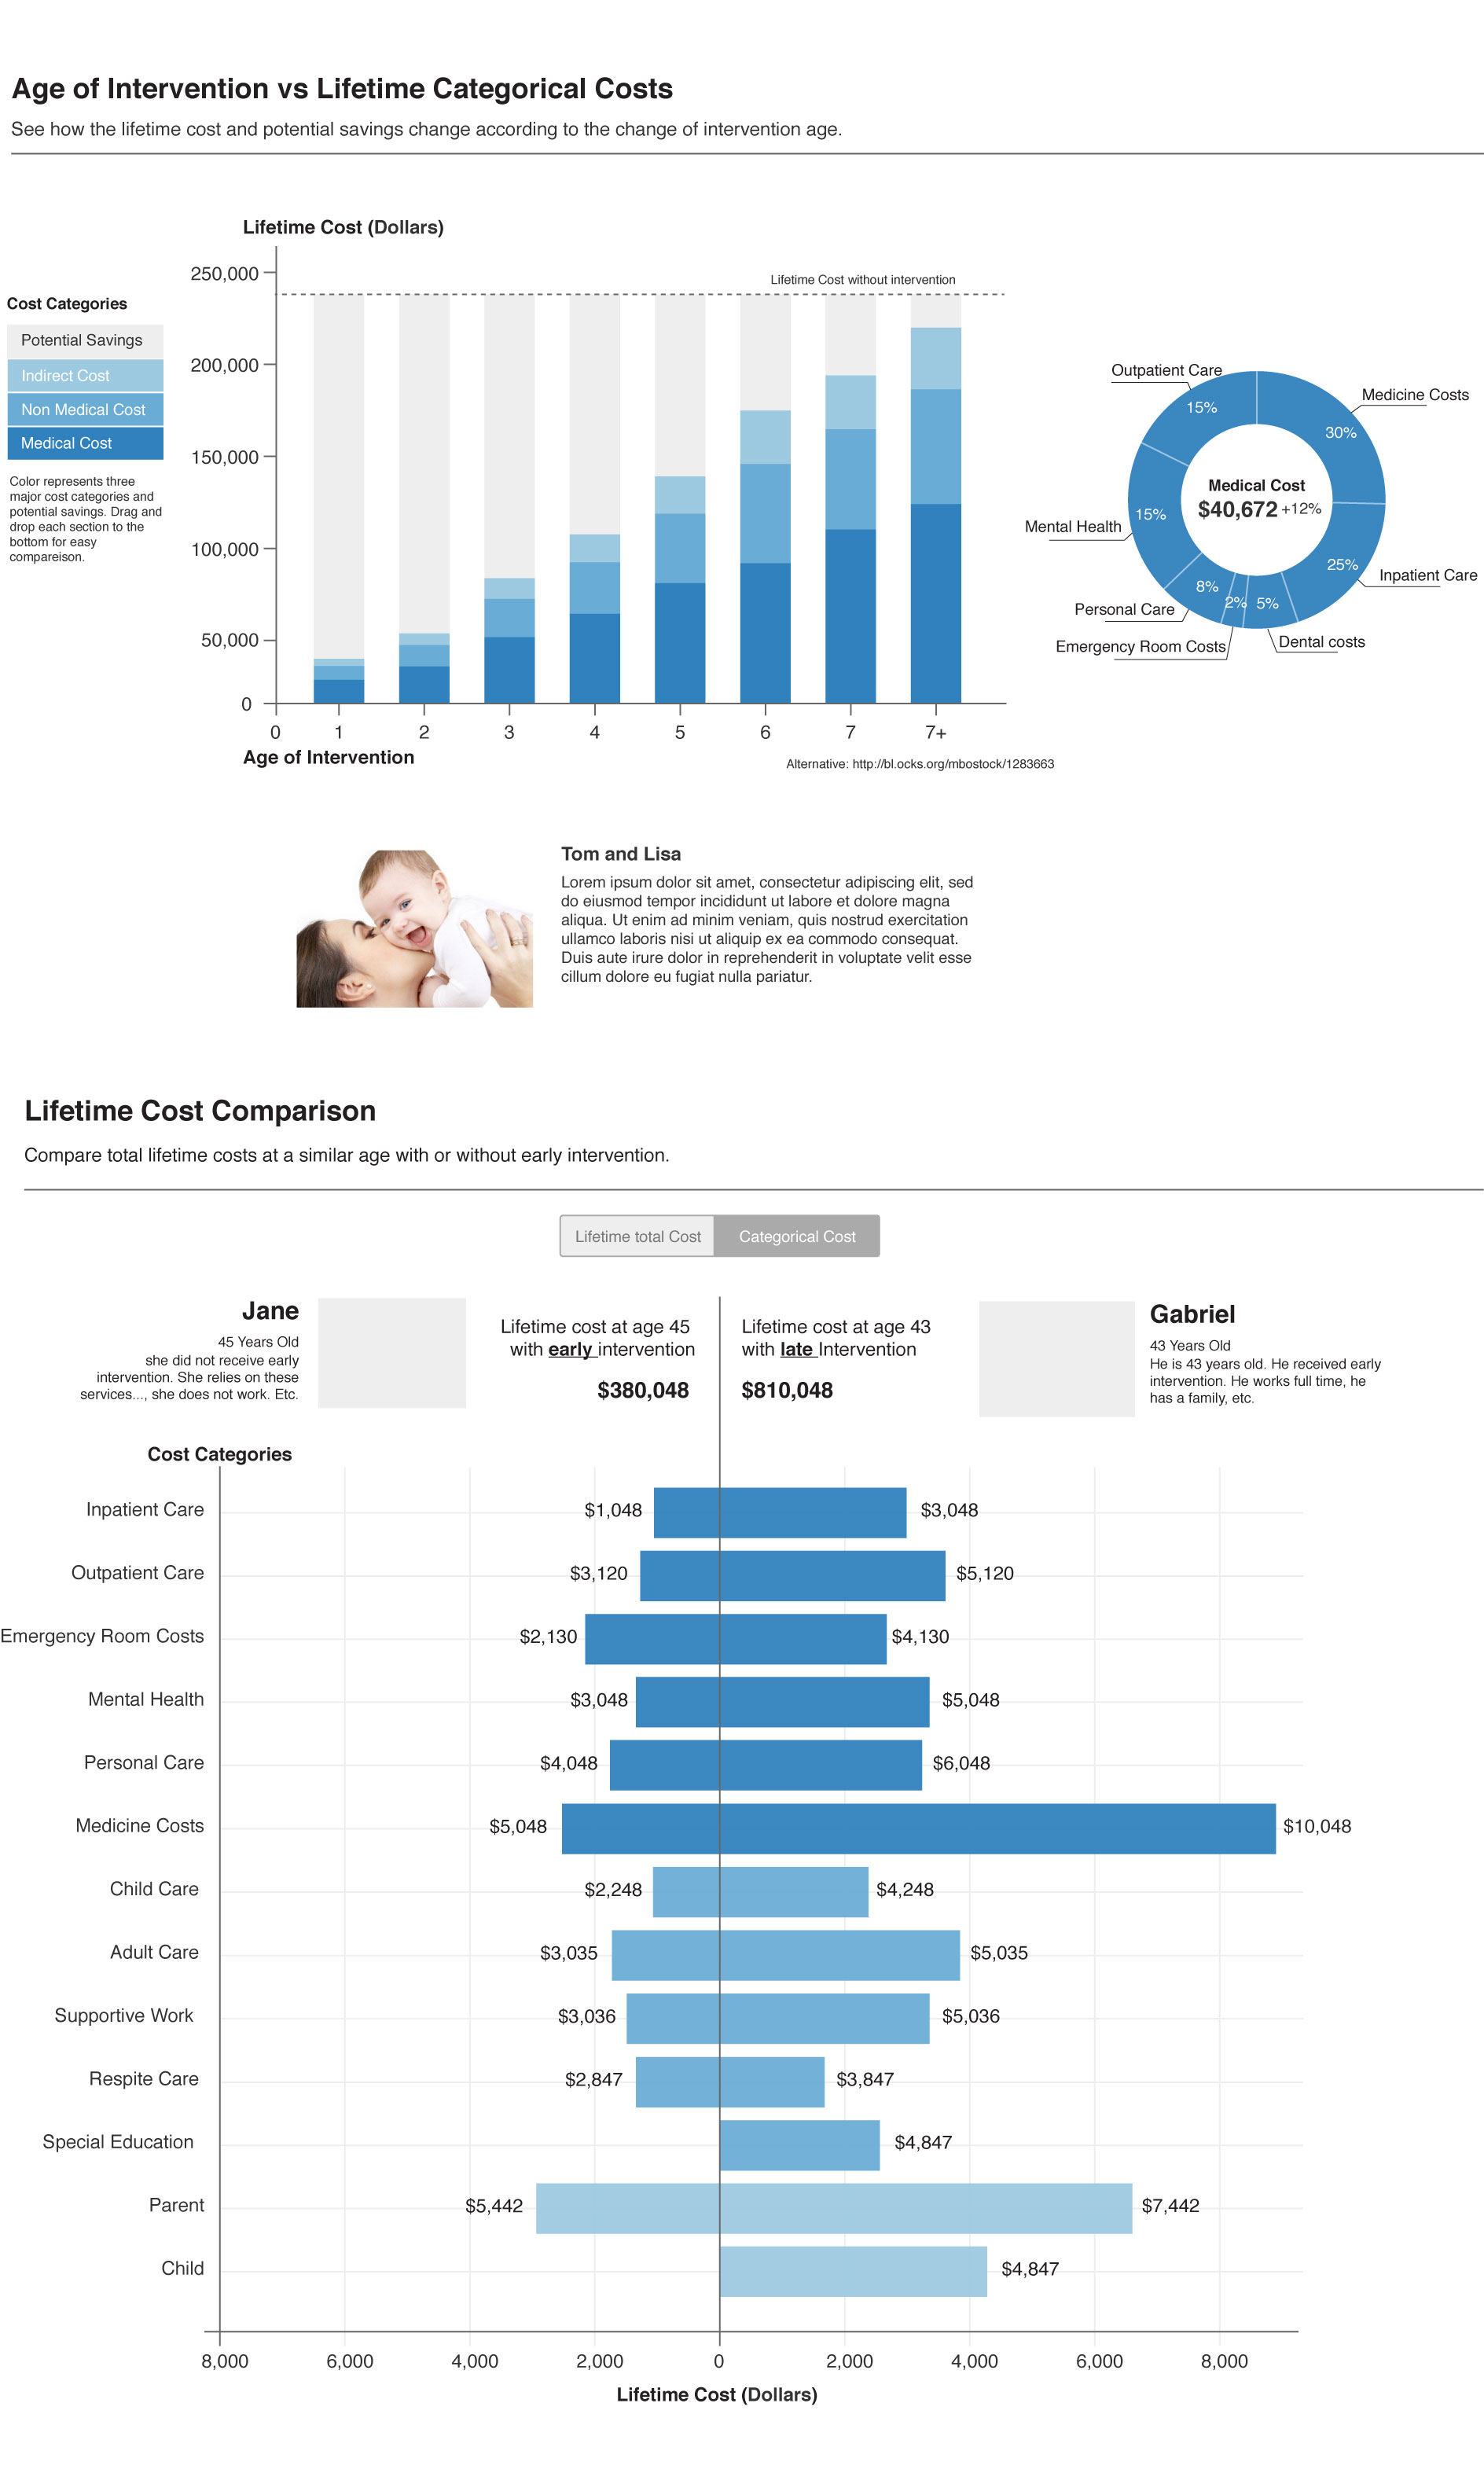
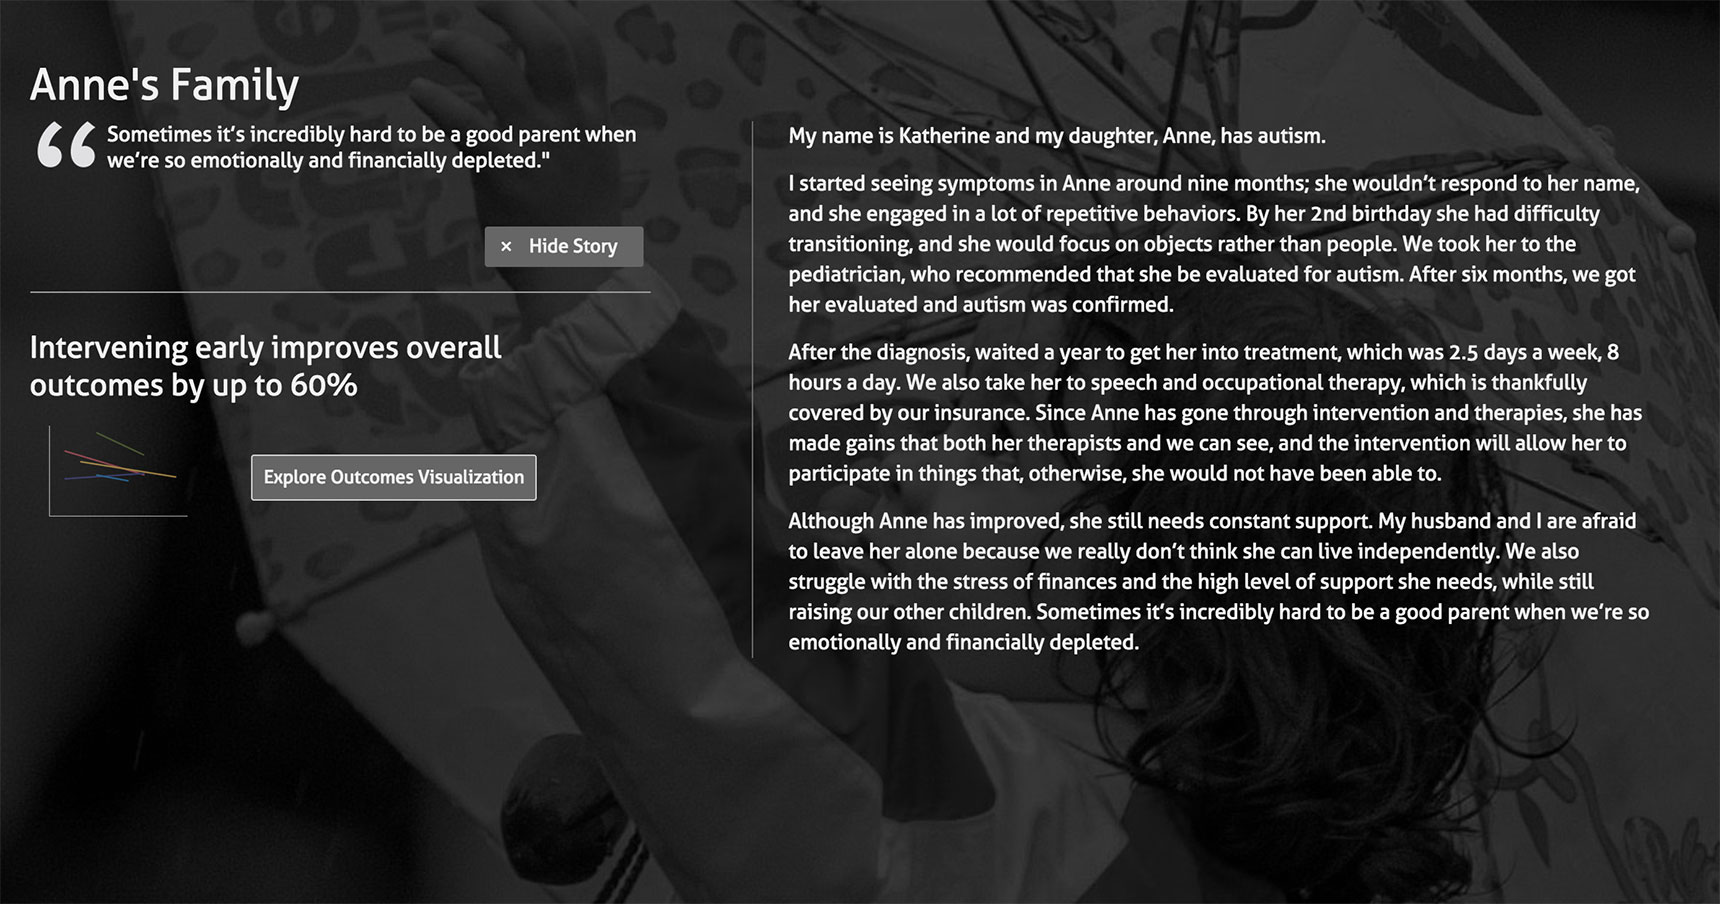
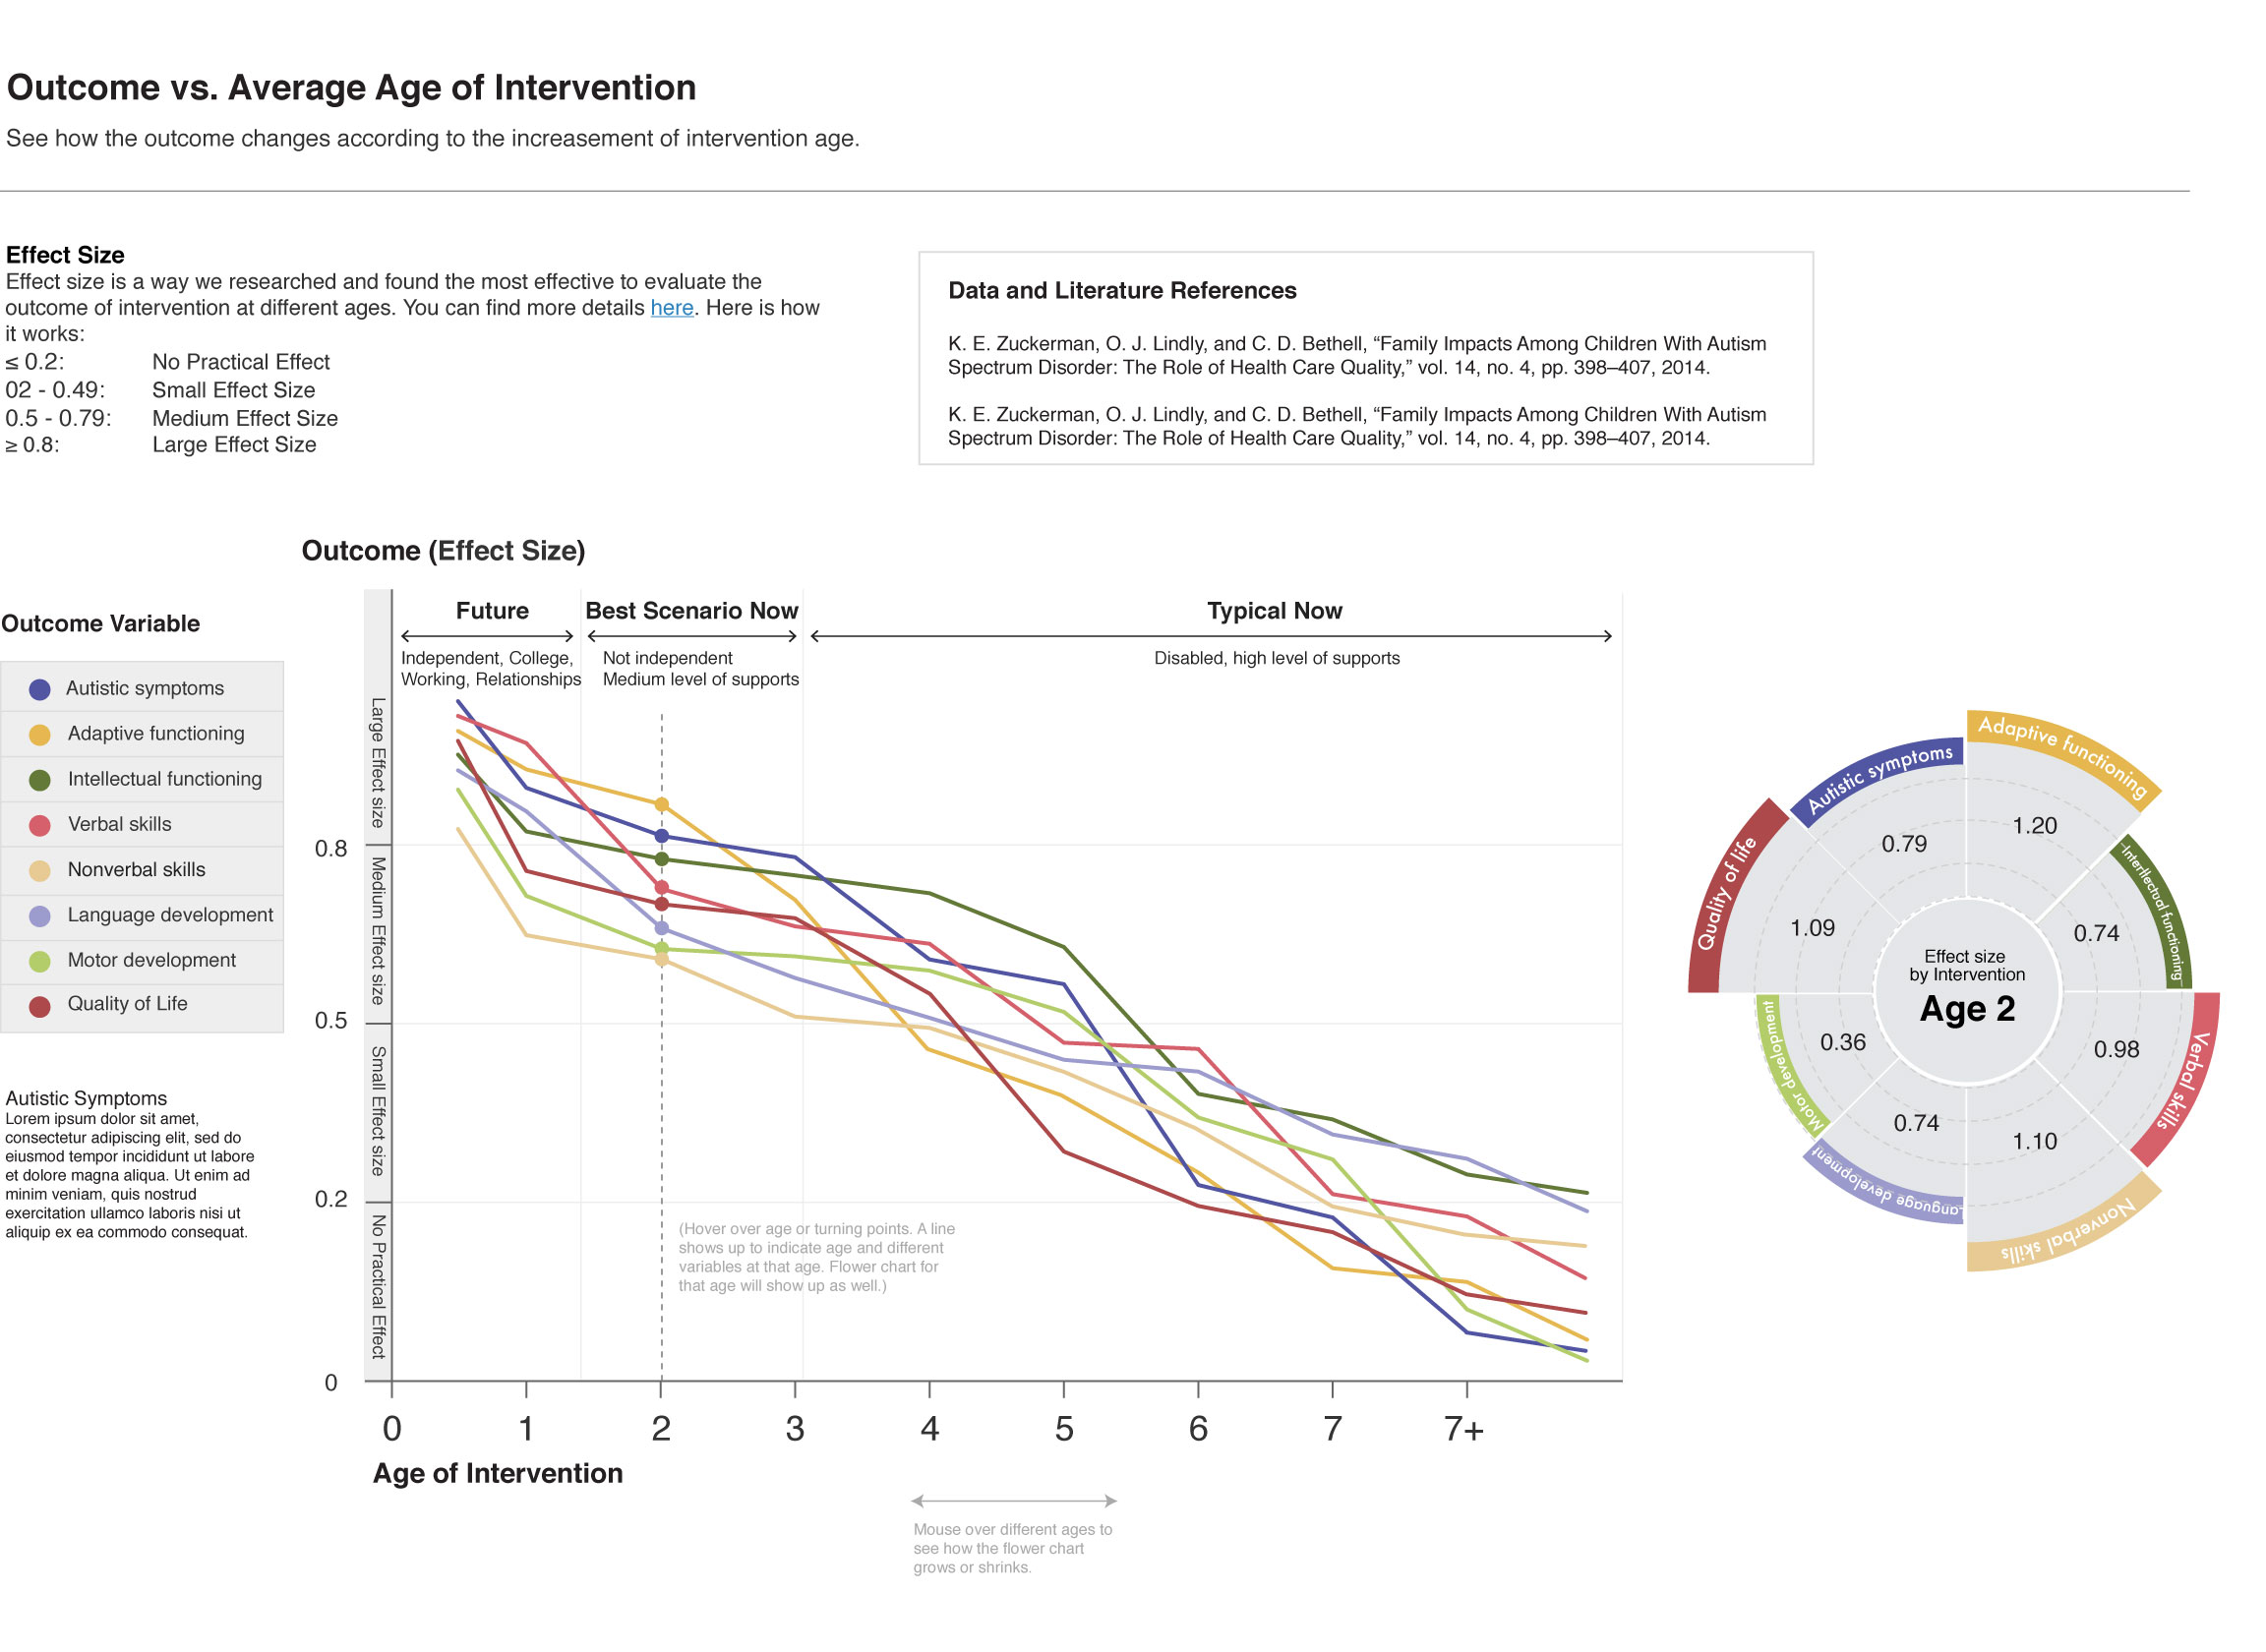
Autism Intervention - Intervening early improves overall outcomes by up to 60%
The literature shows that, typically, the younger a child is when s/he receives intervention, the btter the outcomes. This includes improved functioning, decreased autism symptoms, increased intellectual functioning and developmental growth, as well as an increase in quality of life.
Note: Data in the chart above is dummy data for design concept purpose only. The actual implementation is similar.
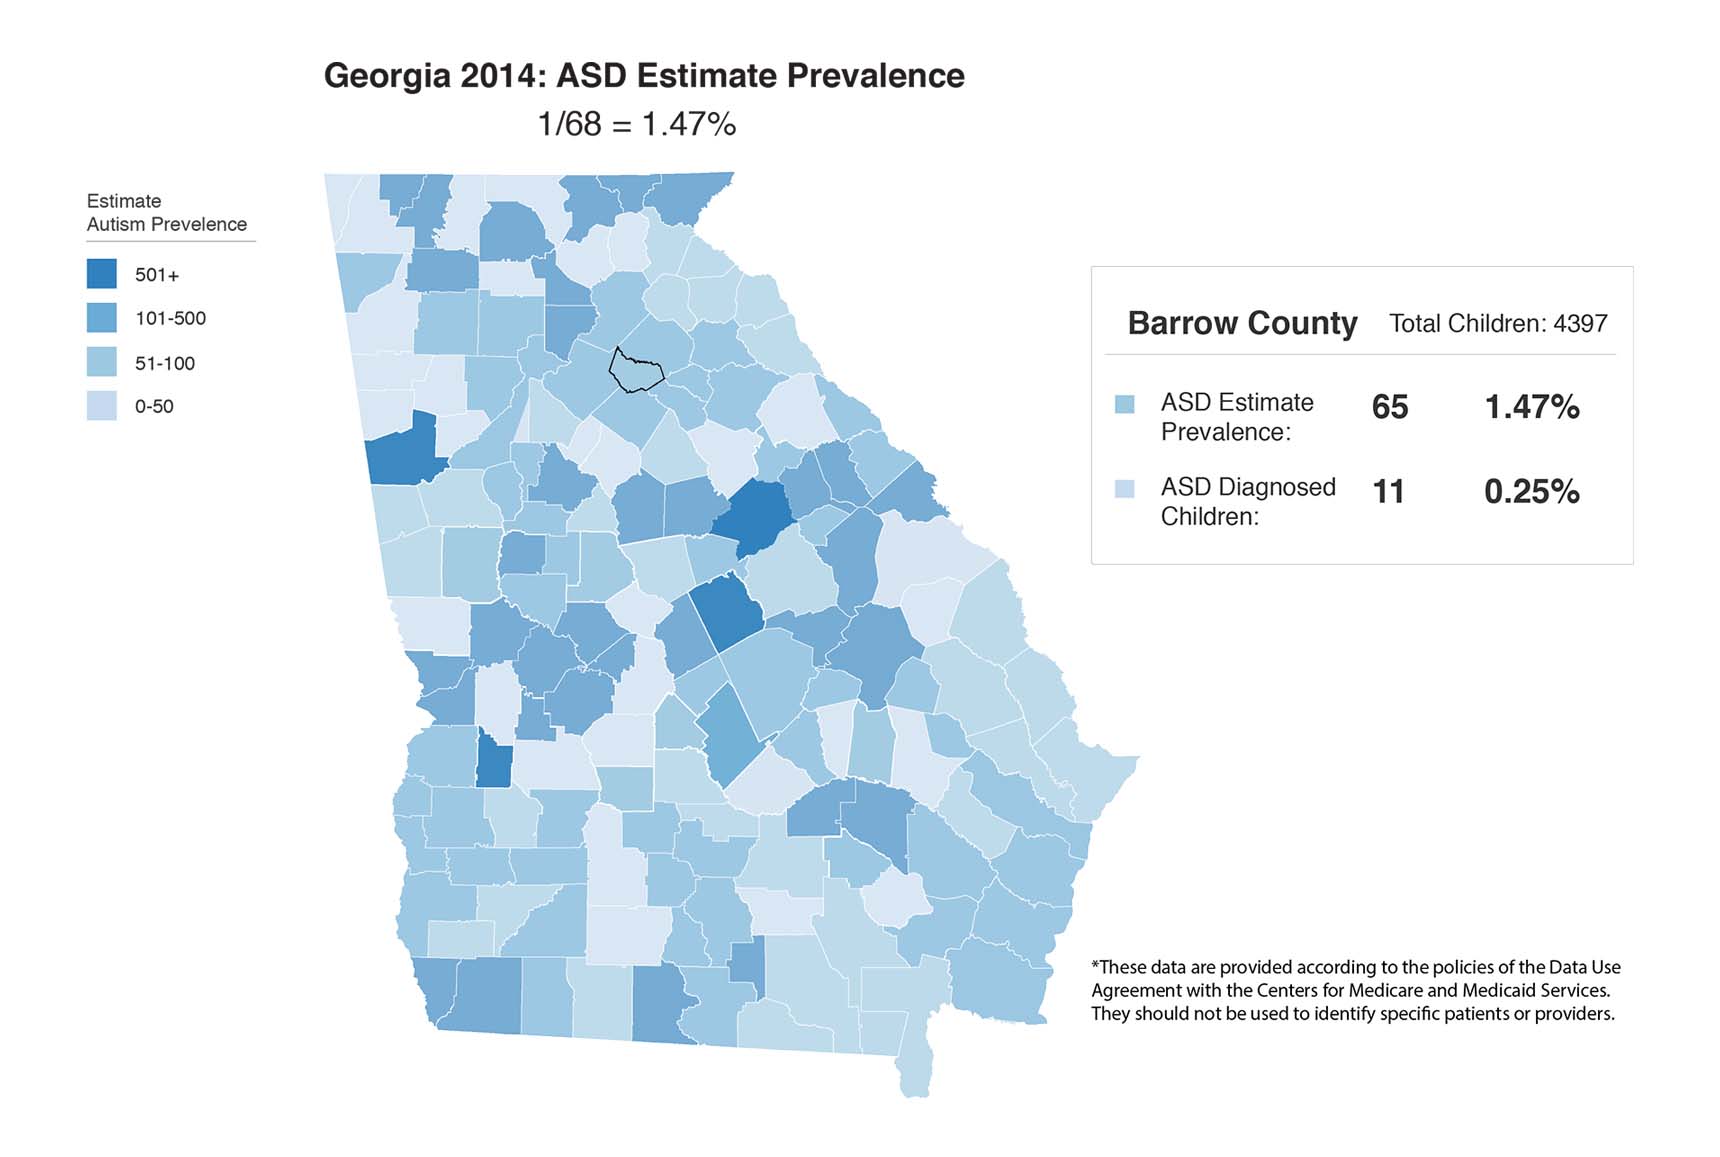
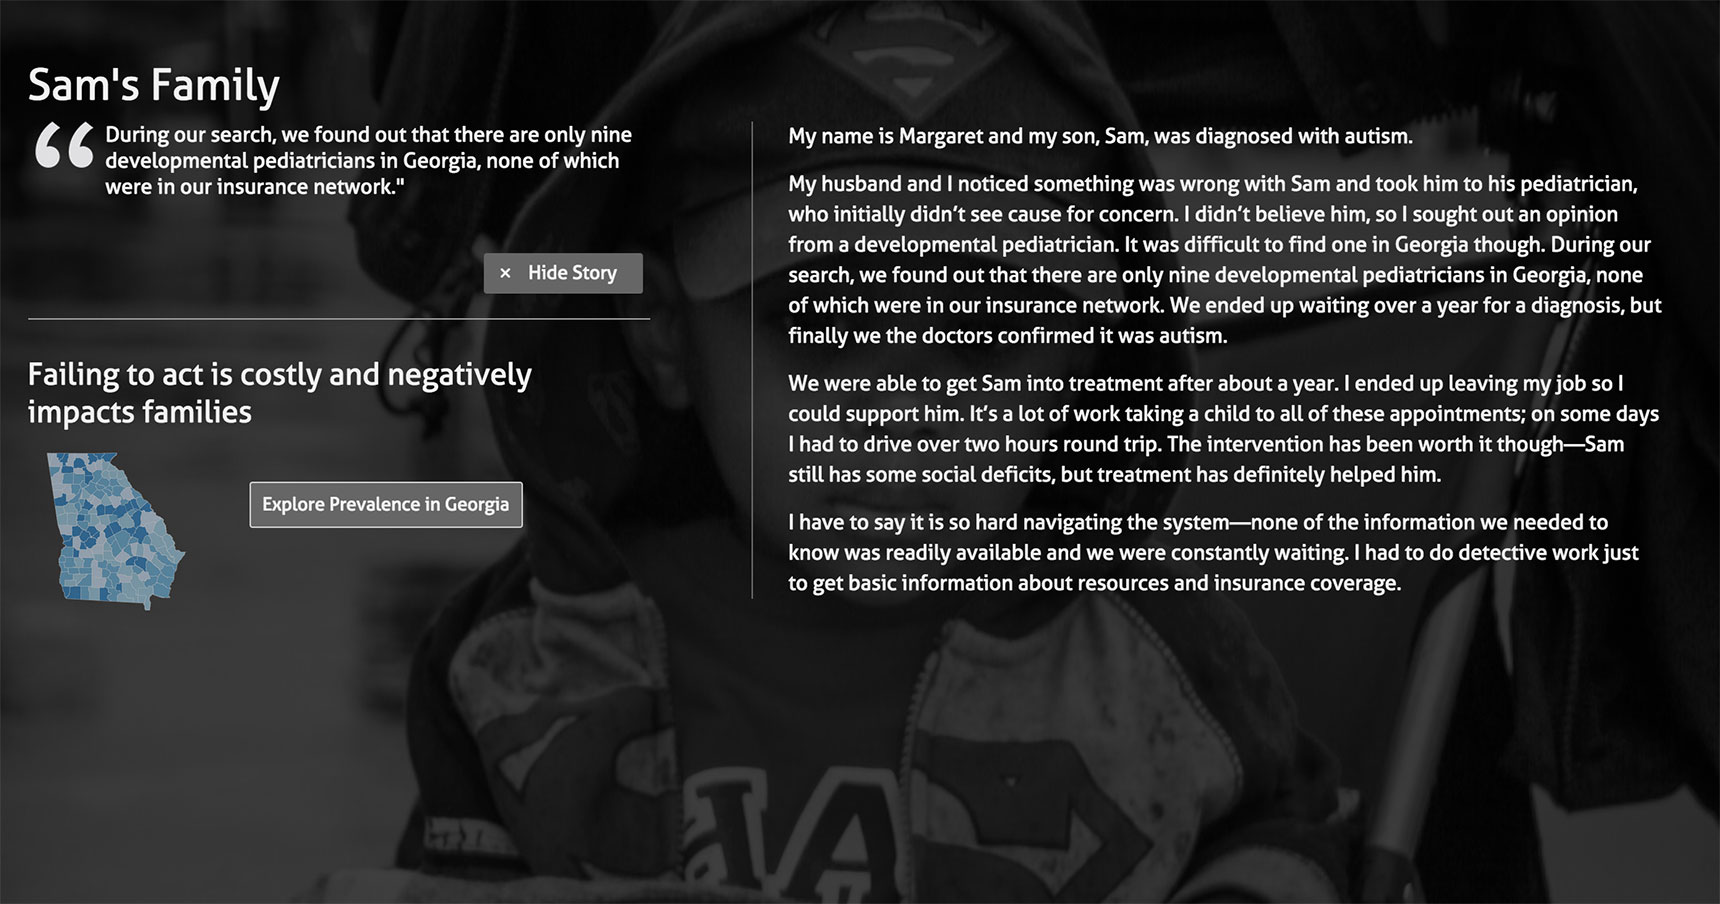
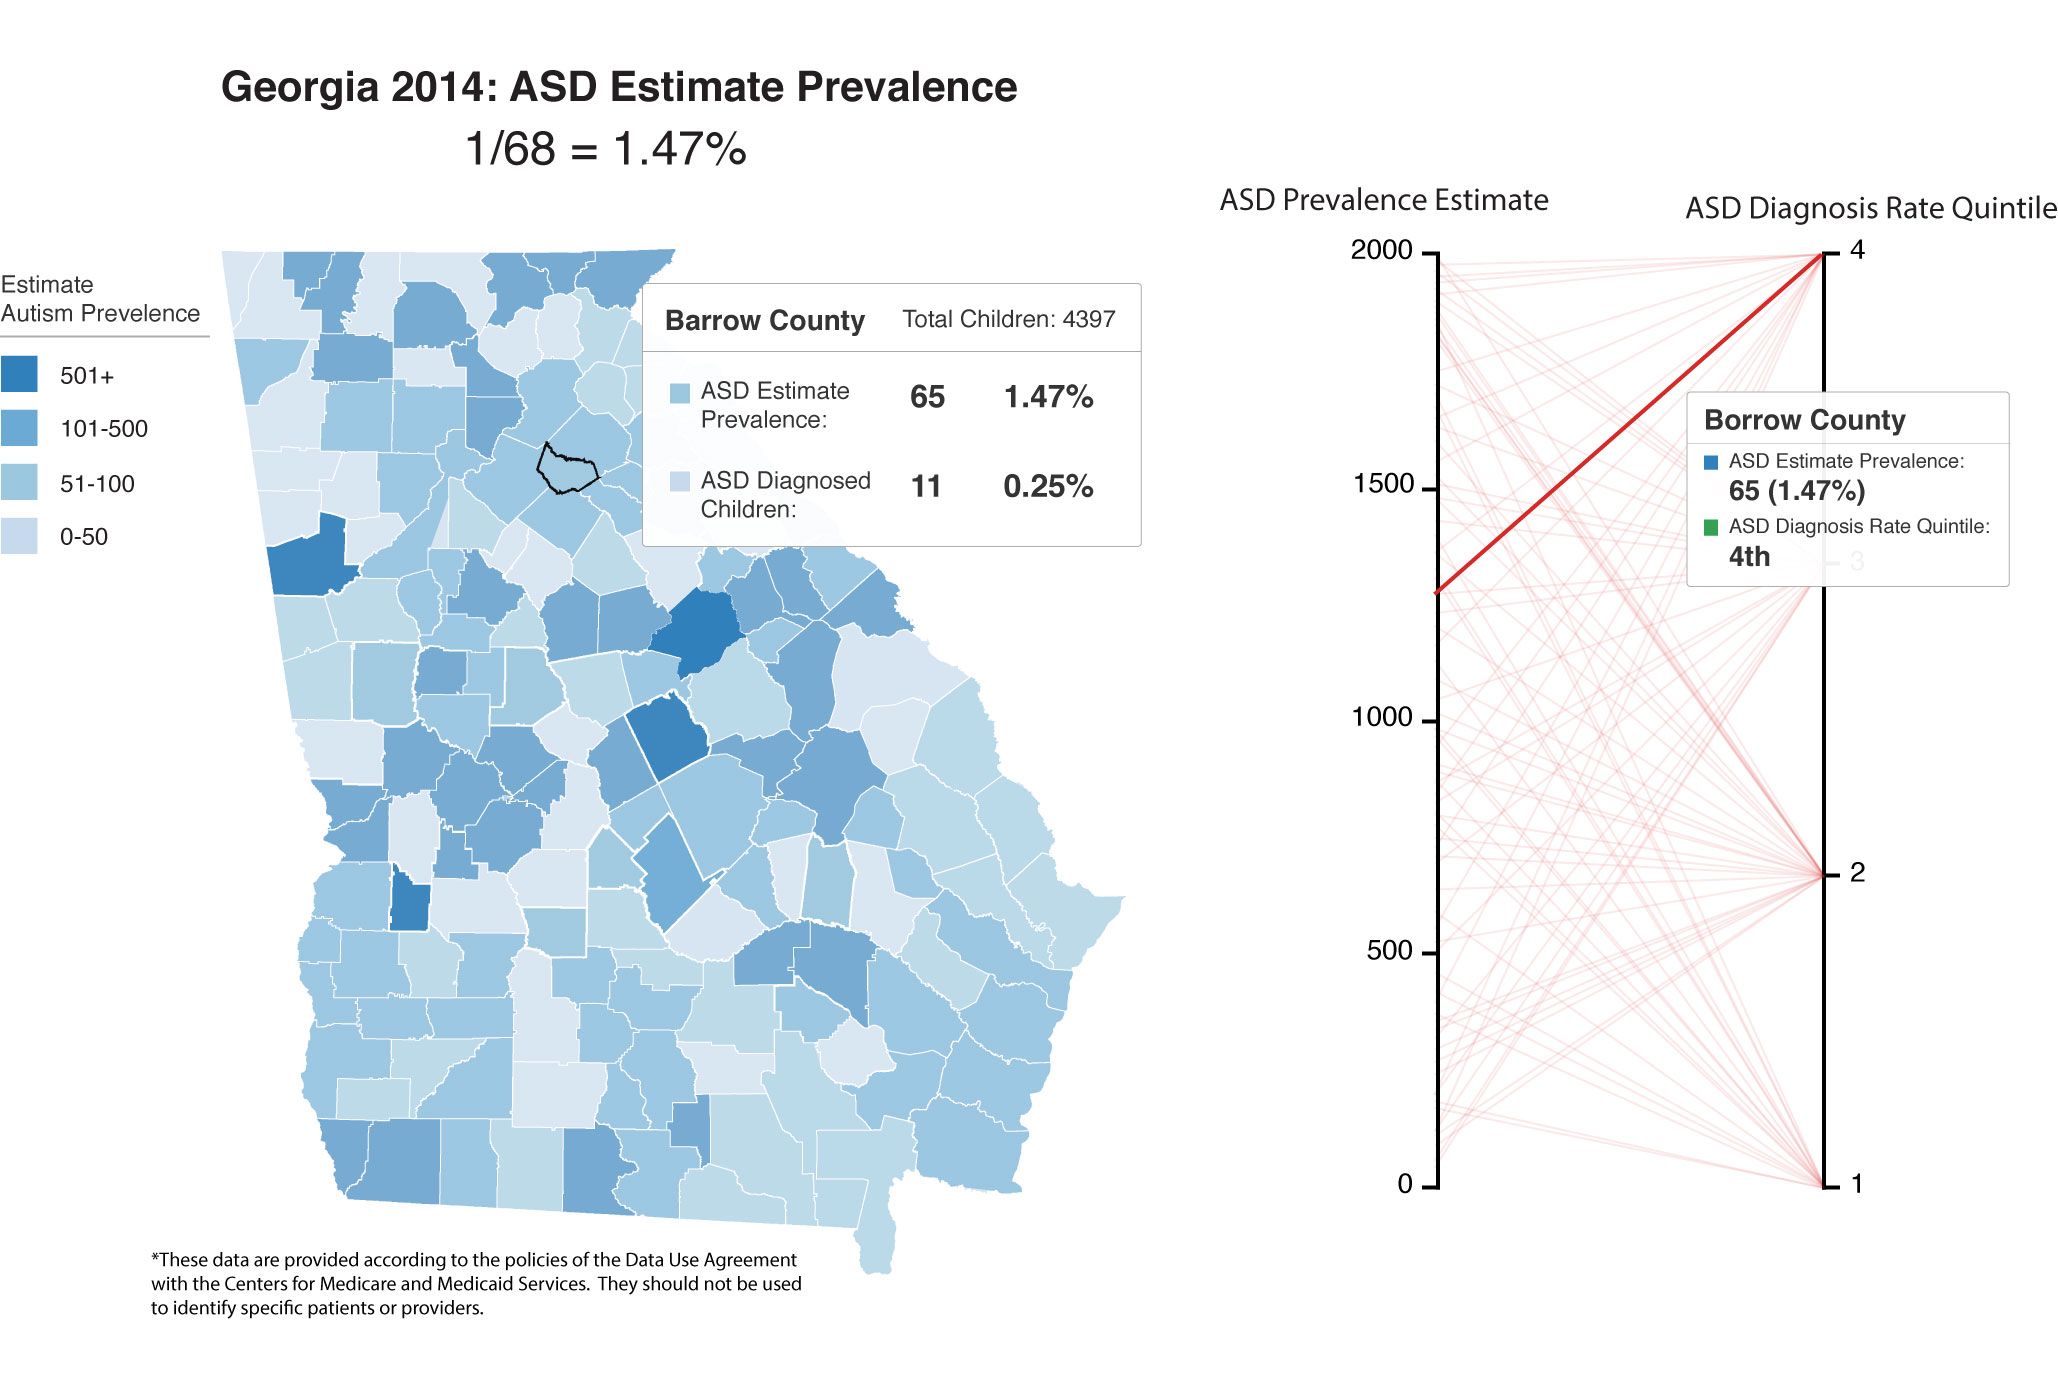
Autism Prevalence - Failing to act is costly and negatively impacts families
Currently, 1 in 68 children under 8 years has ASD in the US. The prevalence of ASD has increased 30% from 2008 and 120% from estimates from 2000 and 2002. This increase in prevalence does not show any signs of slowing, and will put more financial pressure on locals, state, and federal governments, as well as families.